 Mr. Nap's
Mr. Nap's
Mr. Nap's

Friday May 18, 2012
1) Print and complete meteorology webquest
2) Have a great weekend!
---------------------------------------------------------------------------------------------------------------------------------------------------------------------------
Friday May 11, 2012
1) Print and complete Activity 4a Part 1
2) Complete Activity 4a part 2
3) Have a great weekend!
---------------------------------------------------------------------------------------------------------------------------------------------------------------------------
Friday April 27, 2012
1) Print Activity 3b part 1 and complete
2) Print Activity 3b part 2 and complete
3) Have a great weekend!
---------------------------------------------------------------------------------------------------------------------------------------------------------------------------
Friday April 13, 2012
1) Where did you spend spring break?
2) Research the climatology of the location above. Write one paragraph describing it.
3) Use the rest of the time to make up any missing 3rd quarter work
---------------------------------------------------------------------------------------------------------------------------------------------------------------------------
Friday March 30, 2012
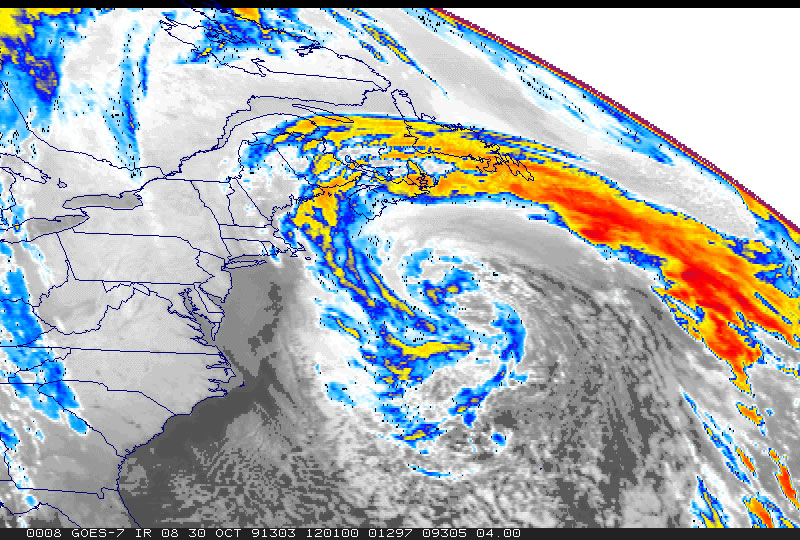
Visit the National Weather Service site on the Perfect Storm
Answer the following questions using the site above and other sites:
1) When did the Perfect Storm occur?
2) Use this page to find the Longitude and Latitude of Gloucester, Maine. What is it?
3) Explain this image
4) What name would the Perfect Storm become officially known as?
5) What does the color-enhanced infrared image of 1200 UTC October 30, 1991 depict?
6) Explain what a Nor'Easter is.
7) What typically happens in October and November to cause them?
8) Describe the events of October 28, 1991 on the Northeast coast.
9) How did Hurricane Grace play a role in creating the Perfect Storm?
10) When the storm reached its peak intensity, what was the pressure (in mb)?
11) What was the lowest pressure ever recorded (Google this)?
12) What is the current pressure reading in Harrison?
13) What is the difference in pressure between the Prefect Storm and the current pressure?
14) How high were the waves during the storm?
15) What presumably happended to the Andrea Gail?
16) What is SARSAT?
17) How did SARSAT play a role in the search for the Andrea Gail?
18) Where and when was the Andrea Gail found?
19) WHat happened to President Bush's home in Kennebunkport, ME during the storm?
20) Describe what happened to the storm on October 31?
21) Admit it, you love meteorology.
-------------------------------------------------------------------------------------------------------------------------------------------------------------------------------------------------------------
-------------------------------------------------------------------------------------------------------------------------------------------------------------------------------------------------------------
Friday March 16, 2012
1) Complete activity 2A Part 1
2) Complete activity 2A Part 2
3) Have a great weekend!
-------------------------------------------------------------------------------------------------------------------------------------------------------------------------------------------------------------
Friday March 9, 2012
Visit Spaceweather.com and answer the following questions.
1) What is a solar flare?
2) What is the "latest update" on the solar flare current hitting the earth?
3) Watch this movie of the sun's eruption. Describe what you see.
4) Now watch this animation of how the flare will move through space. Notice the date changing on top. Until what date will the earth be at risk?
5) (same animation)Which planets are in the direct path of the ejection?
6)
Look at this graph of solar particles hitting the earth. At what date and time did energy peak?
7) Look at this article. List four risks to the earth as a result of the solar flare.
8)
Look at the NOAA Spaceweather scale for geomagnetic storms. We are being hit by an S3 solar radiation storm. Use the scale to describe the effects of an S3.
9) What are the effects of an S5?
10) One effect of solar flares are aurora borealis. What is aurora borealis? Where is it visible? Have you ever seen it?
11) Watch the youtube video at the bottom of the page. What do you think? In the video it descibes what colors reach which altitudes. Which color reaches the highest altitude?
12) Have a nice weekend!
------------------------------------------------------------------------------------------------------------------------------------------------------------------
Friday March 2, 2012 -- Please type your answers in Word.
1) Click on the daily summary for Monday (below). Write a summary of the major winter storm that hit us last week.
2) Look at the winter climate sumary for our area. Answer the following questions:
a) What date range does this climate summary cover?
b) What was the highest and lowest temperature in the time period? On which dates?
c)
What was the total snowfall (in inches) during this time period?
d) What and when was the record snowfall in the time period?
e)
What was the total number of day in the period in which light snow, heavy snow, or snow was reported (add all three together?
3)
Research the education and training needed to become a meteorologist.
You will need to write down your answers to the following questions:
a) What is the definition of a meteorologist?
b) What training do you need?
c) What information do you feel should be included in a weather report (forecast)?
------------------------------------------------------------------------------------------------------------
Friday February 17, 2012
1) Print the Daily Summary form.
2) Follow the directions on the form to fill in each summary.
3) look up the five day forecast for the location where you will spend next week. Summerize the forecast..
4) Surf some weather sites to get familiar with their layout.
5) Have a great vacation!
------------------------------------------------------------------------------------------------------------------------------------------------------------------
Friday February 10, 2012
1) Print and complete Activity 1A.
2) Print the Daily Summary form.
3) Follow the directions on the form to fill in each summary.
------------------------------------------------------------------------------------------------------------------------------------------------------------------
Friday February 3, 2012
1) Print the Daily Summary form.
2) Follow the directions on the form to fill in each summary.
3) Surf some weather sites to get familiar with their layout.
4) Have a great weekend!
------------------------------------------------------------------------------------------------------------------------------------------------------------------
| Monday | Tuesday | Wednesday | Thursday | Friday |
| Monday | Tuesday | Wednesday | Thursday | Friday |
| Infrared - Latest | Infrared - 00Z | Infrared - 12Z |
| Visible - Latest | Visible - 18Z | |
| Water Vapor - Latest |
| 12 Hour | 24 Hour | 36 Hour | 48 Hour |
| NWS Forecast (text) | |||
| Short-term Forecast | |||
| Meteorologist's Report (What do all those contractions stand for?) | |||
| Available Forecast Stations | |||
|
|
Current NY looping infrared satellite | Current NY looping radar | |||||
| Blank Metgram | |||||||
| Blank US Map | Weather Map Symbols | ||||||
| Blank Stuve - T,p lines | Blank Stuve - all lines | ||||||
| |||||||
Updated Sunday, April 01, 2007 01:00:08 PM