The three Earth images were acquired when sunset was occurring at the point on the equator directly below the viewing satellite (in the center of the Earth’s disk). Sunset was occurring along the dashed line passing through the sub-satellite point. The arrows to the left in each image represent incoming rays of sunlight at different latitudes.
Compare the 23 September image (Image 1) with
Figure 3.9 (Image
4), showing
autumnal and vernal equinox Earth/Sun relationships. Note that in both, the
sunset line and the Earth’s axis line up together and are oriented
perpendicular to the sun’s rays. Because the Earth rotates once in 24 hours,
the period of daylight is ______ hours everywhere except right at the
poles.
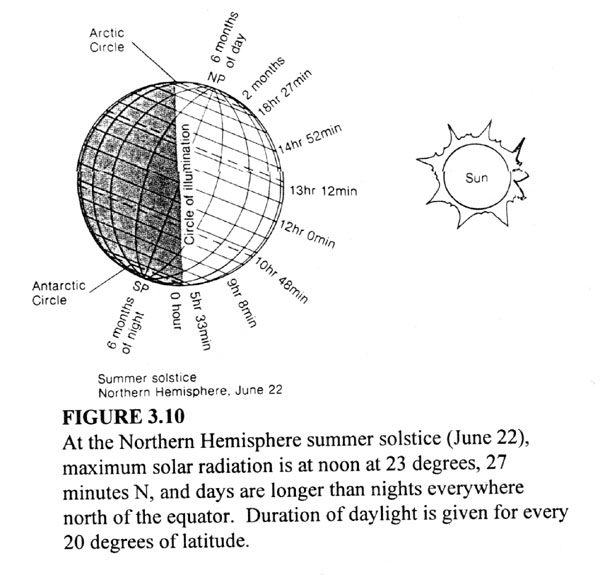
Along with these variations in the length of daylight at various latitudes
as shown in the satellite views, the intensity of incoming sunlight varies
with the angle of incidence at the Earth's surface as seen in the arrows drawn
for the Equator and the North (or South) Pole. (A latitude line could also be
added at your latitude.) Thus, the solar energy received at a location over
the course of the year depends on the solar altitude (angle of the sun
above the horizon) and the period of daylight.
As we progress through the Spring to the Summer Solstice and on to the next Fall season, call up DataStreme visible satellite images near times of sunrise or sunset and observe the orientation of the terminator line. Relate this "remote" view of the Earth/Sun relationship to the path of the Sun through your local sky and the length of daylight at your location. Also note the general cooling of temperatures associated with these changes in solar altitude and period of daylight.
To estimate amounts of solar radiation received in Harrison for the various months of the year similar to that given in Figure 1 of Activity 3B, you can call up http://solstice.crest.org/renewables/solrad/data/index.html. Because this site is designed to calculate the energy from solar collectors, you need to choose the option of a "flat-plate collector at 0° tilt" along with your location from the map. Finally, the energy units of kilowatt hours per square meter per day need to be multiplied by 86.04 to obtain calories per square centimeter per day as used in this activity.
©Copyright, 1999,
American Meteorological Society