

Science
Rules!
Sunspot Activity
In this fun activity you will describe sunspots and make a graph of sunspot data from 1900 to the present in Microsoft Excel.
PART 1: ABOUT SUNSPOTS
Directions: Use the
following website to answer questions 1 - 4:
SpaceWeather.com
1. What is today's date and sunspot number? __________
If you divide this number by 15, you'll get the approximate number of individual sunspots visible on the solar disk if you look at the Sun through eclipse glasses. How many spots would be visible today? ____________
2. What is meant by the sunspot number? _______________________________________________________________________________________________
3. What is the current streach of "spotless days?" _______________ days
4. Which year listed contains the longest stretch of spotless days? year = ___________________ number of days = __________
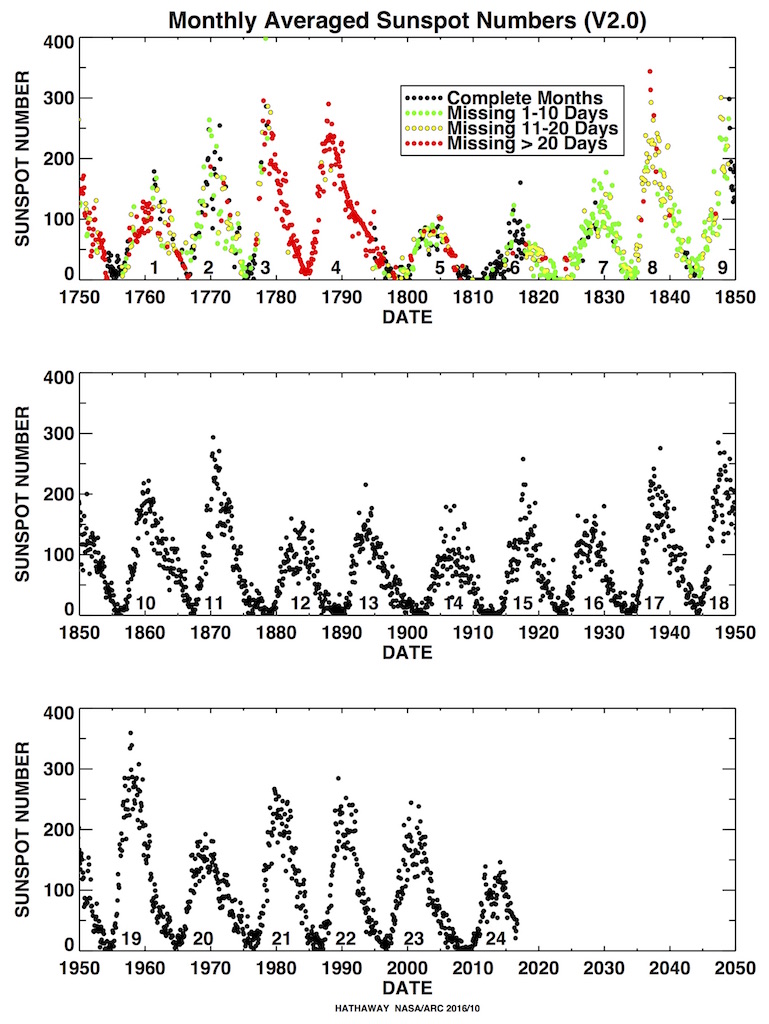
5. According to this graph, in what year
did the last sunspot maximum occur? _____________
6. Approximately how many years apart are soloar maximums? ___________.
7. The next solar maximum will most likely occur in the year ____________.
8. Now check out this graph of solar max predictions. How many years off were you in #7? ______________
9. What does a
BUTTERFLY DIAGRAM show? ______________________________________________________
10. What are
sunspots? ______________________________________________________________________
11. Check out this live image of the sun. Draw the image of the sun here. Sketch where sunspots are currently occurring. Be sure to write down the date the image was taken.
12. Opinion Question--How large do you think a sunspot is compared to Earth? ______________________________________
13. Check out this photo of a sunspot. Now how large do you think a sunspot is compared to Earth?
------------------------------------------------------------------
PART 2: MAKE A GRAPH IN EXCEL
Open the program
Microsoft Excel and follow the next set of directions to construct
a sunspot graph. Once Excel is open:
a.. Type "year" in cell A1 (without the quotes).
b. Type "sunspot data" in cell A2 (without the quotes).
c. To insert sunspot data:
- Open this page of sunspot data from 1700 to the present.
- Type the data from 1900 to the present into Excel. Put all the years in column A and the sunspot number in column B.
- Highlight all cells you typed in intand click the Insert tab.
- Click on line. Choose the first 2D line graph.
- Right click on your graph and click on "select data."
- Highlight "year" and click "remove."
- In the same window, uder "Horizontal (Category) Axis Labels," click "Edit."
- When the Axis Label window opos up, click on cell A1 (1900) and drag it down to the current year.
- Click "OK" twice
- Drag the corners to make your graph as large as you can fit on a page.
- Optional: Click on "Design" and change the look and colors of your graph.
d. Save your file as "(your name) sunspots"
e. Print your graph.
-----------------------------------------------------------------
USE YOUR COMPLETED GRAPH TO ANSWER THE FOLLOWING QUESTIONS--PLACE ALL ANSWERS ON YOUR ANSWER SHEET.
12. In which years between 1900 and now did a sunspot MAXIMUM occur (list all years)?
13. In which years did a sunspot MINIMUM occur (list all years)?
14. Based on your graph, predict when the next two maximums will occur.
15. How often does a sunspot maximum typically occur?
16. This graph
pattern is:
circle one (DIRECT
INVERSE
CYCLIC
NO RELATIONSHIP).
17. There's no evidence, but some people claim that sunspots affect life on Earth. Some people think that even fashion styles and the performance of stocks are affected by sunspots. Compare this timeline of major events to your completed graph.
Do you see any connection? Explain.
---------------------------------------------------------------
- Page created by Frank Napolitano
- Science Rules!