Name _______________________ Date___________ Period_____

Activity 1B:

AIR PRESSURE AND WIND

back to meteorology home page

Do Now:

  1. Print this file.
  2. Print the Activity 1B Response Form.
  3. Print the Image 1 and Image 2 Files.
  1. The Image 1 "Isobars, Fronts, Radar & Data" map acquired from DataStreme is the depiction of weather conditions at stations across the contiguous US at 00Z 06 SEP 1999, the same time as the map you analyzed in Activity 1A. Weather data at individual locations are plotted in a coded format called the "station model". The station model will be explained in Activity 2A. As you will recall, the remains of Dennis, at this point a tropical depression, were centered in North Carolina.

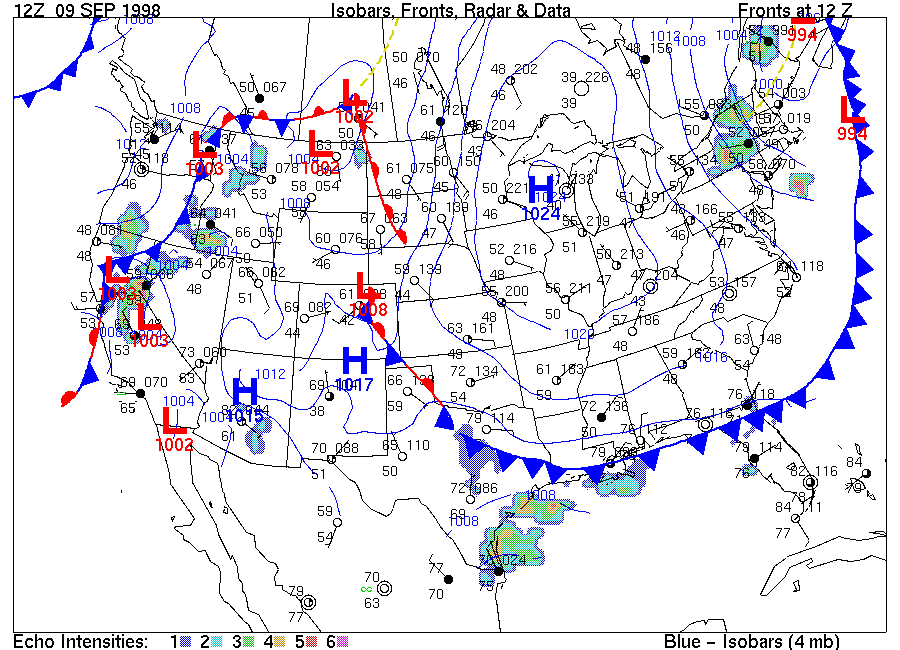
    Greensboro, North Carolina, is the station showing "023" to the upper right or "1 o'clock position" of the circle representing the city position. This number is a coded value signifying an atmospheric pressure report of 1002.3 millibars. Place a bold L inside the 1008-mb isobar surrounding the Greensboro area to denote this low-pressure center.

    A center of high atmospheric pressure was located in the Atlantic Ocean at the upper right edge of the map. Draw a bold H a half inch or so in size at the map edge where the left side of the plotted "H" can be seen.

  2. The wind directions at reporting stations on the 00Z 06 SEP map are shown by the line (which can be thought of as an arrow shaft) which depicts the air flow into the station location (shown by the circles). Wind at a station is named by the direction from which the air flows, i.e., air coming towards the station from the south is a south wind. The wind speed is given by a combination of long and short "feathers" on the direction shaft. Details for deciphering station data are given in your Homepage User's Guide (linked from the DataStreme Homepage). For example, at map time, Cape Hatteras, NC (on the coast east of Greensboro), had a 15-knot wind. The wind direction at Cape Hatteras was from the [(northeast) (southeast)], so it was a [(northeast) (southeast)] wind.

  3. Apply the hand-twist model of a Low to infer the wind directions that should be around the low-pressure center in NC. Wind directions at stations in the several state area around the L show that, as seen from above, the air spiraled generally [(clockwise) (counterclockwise)] around the low-pressure center.

  4. The observations around the Low also indicated that the air generally spiraled [(inward toward) (outward from)] the low-pressure center. This pattern is [(consistent with) (contrary to)] the hand-twist model of a Low.

  5. The high pressure whose center you marked with an H in the Atlantic affected winds in the New England states of the northeastern US. The air motions, as shown by the wind arrows at stations from Maine to New York tend to indicate that the air spiraled generally [(clockwise and outward) (counterclockwise and inward)] around a High. This pattern [(is) (is not)] consistent with the hand-twist model of a High.

  6. How does the current weather compare with weather in early September a year ago? Image 2 is the surface map ("Isobars, Fronts, Radar & Data") of weather conditions at stations across the US at 12Z 09 SEP 1998. This map is more typical of those maps you are likely to see in the coming weeks as temperature contrasts increase across the continental US. At the time of Image 2 a well-defined mass of cool, Canadian air (continental Polar or "cP") was entering the east-central US. The center of this air mass was located in Wisconsin at map time.

    In the several states east of the High center, the winds are generally from the [(west or northwest) (east or southeast)]. To the south of the High center the winds are generally from a(n) [(easterly) (westerly)] direction. To the west of the High center, wind directions are generally from the
    [(north or northwest) (south or southeast)]. Taken together, these winds spiral generally [(clockwise and outward) (counterclockwise and inward)] around the High. This pattern of winds [(is) (is not)] consistent with the "hand-twist" model of a High.

When the centers of fair weather Highs or stormy Lows are near your location, you might try having students fit your local wind direction (as shown by a school ground flag, for example) with map circulations and the hand-twist model of weather systems. (One note: the hand-twist model must be applied cautiously in the western US where mountainous terrain can be a predominant factor affecting wind directions.)

back to meteorology home page